




Global Economic Outlook: An Economy Running at Different Speeds


Senior Vice President, Economist
Summary:
- The global economy continues to expand at a resilient pace, but growth momentum is more concentrated in select sectors, regions and consumer groups.
- AI and technology-related investment and trade have supported growth momentum in some economies, while the Iran conflict and related higher energy costs have created headwinds, particularly for energy importers. Both drivers are contributing to inflation in different ways.
- Reemerging inflation could feed into claims severity pressures and keep interest-rate expectations elevated, while AI-linked capital investment, supply-chain shifts, and diverging consumption patterns may affect where insurance demand and exposure growth emerge.
Two forces shaped the global economy in the first half of 2026
The AI linked investment cycle and geopolitics linked energy supply pressures. Global GDP is expected to expand at a resilient pace of 3.0% in 2026 and 3.4% in 2027, according to the IMF World Economic Outlook. [1] The modest slowdown for 2026 reflects the economic drags from the middle-east conflict, which are partly offset by strong momentum in the global technology cycle.[1] Beneath the resilient headline, however, growth is uneven as high energy costs and the AI investment cycle, pulls economies, industry sectors, and consumers in different directions.
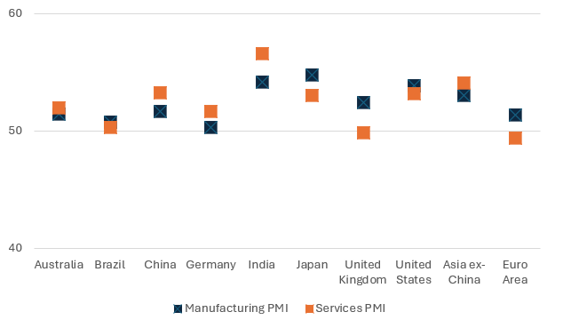
Incoming data point to continued expansion. June Purchasing Managers’ Index data show manufacturing and services activity expanding across most major advanced and developing economies (Figure 1). Business sentiment, which had dipped during March and April, has since shown signs of recovery.
Figure 1: Manufacturing and services activity is generally expanding across economies
Source: S&P Global, CEIC.
Note: Data as of June 2026. Readings above 50 indicate expansion, while below 50 indicate contraction
However, the forces carrying the expansion are uneven
Elevated energy prices linked to supply disruptions in the Strait of Hormuz, could add to cost pressures and weigh on economic activity, as higher energy costs are likely to weigh on margin-sensitive businesses and erode household purchasing power. The effects are likely to be more acutely felt in net energy-importing economies, especially among those with limited oil reserve buffers, where higher import bills can contribute to widening external imbalances, rising currency pressures, and an upward repricing of interest-rate expectations.
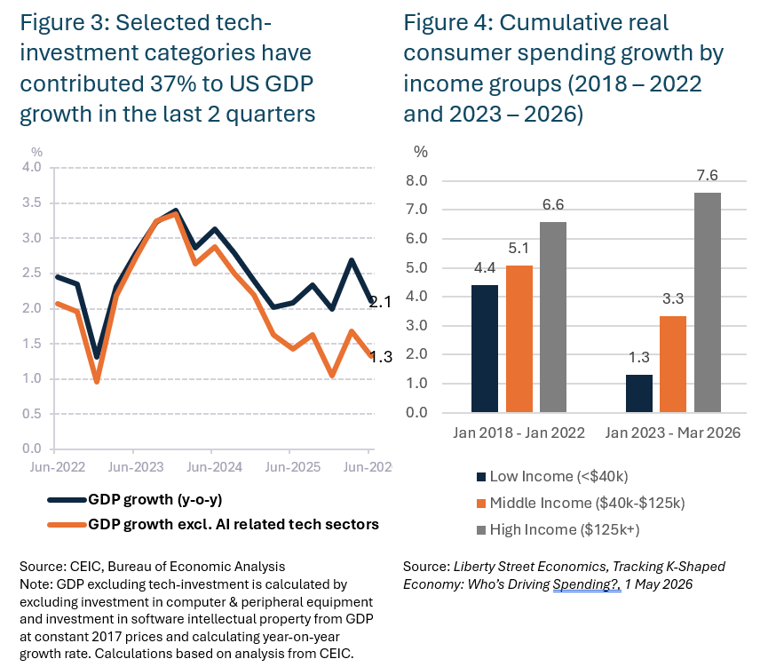
At the same time, technology-investment linked to the AI build-out is contributing to growth momentum in selected markets. This is visible in the US, where recent GDP growth data show strong contributions from information processing equipment, R&D and software categories, that can be associated with the ongoing AI investment cycle (Figure 3). Meanwhile, economies integrated into related hardware and semiconductor supply chains, such as Taiwan, South Korea, Malaysia, China and Japan, are seeing stronger technology-related exports, and rising contributions from tech-related sectors to GDP growth. [2]
These two forces affect inflation in different ways
Supply disruptions in the Strait of Hormuz are contributing to higher freight and energy costs, and can contribute to second round inflation effects, feeding into transport, food, fertiliser, and broader input costs. On the other hand, increasing prices of semiconductors and memory chips, associated with strong AI-infrastructure related demand, are feeding into electronics prices more broadly. [3]
AI infrastructure developments, particularly in the US, have also been linked to electricity price increases [4]. In conjunction, reemerging inflationary forces have stalled the disinflation trend in some economies and may reduce the scope for policy interest rate reductions.
The result is a global expansion that looks resilient in aggregate but drivers are more divided. AI-linked sectors, capital-intensive industries, energy exporters, and higher-income consumers show stronger momentum, while energy importers, lower- and middle-income households, small businesses, and rate-sensitive sectors face more pressures.
Figure 2: Headline CPI inflation change for select global economies since the start of the Iran conflict
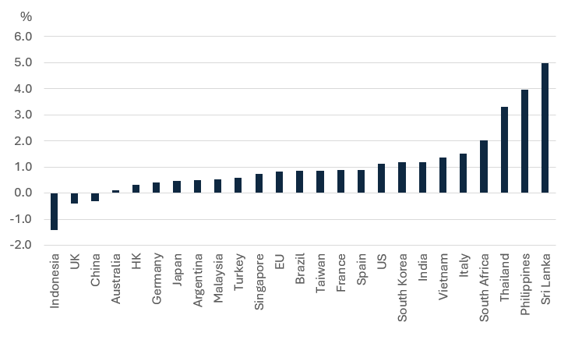
Source: CEIC. Note: Peak Re calculations. Change in year-on-year headline CPI inflation rate for June 2026 compared to February 2026
Geopolitical and trade fragmentation continues to shape the landscape in more structural ways. Outside of the cyclical drivers, trade restrictions and tariffs, supply-chain rerouting, and rising importance of industrial policy and public spending in areas such as advance manufacturing, critical mineral and manufacturing supply chains, defence, energy security and infrastructure continue to remain relevant for investment flows, production and growth support.
Potential risks to the growth outlook
Risks to the outlook could come from the possibility of a prolonged Middle East conflict and continued disruptions in the Strait of Hormuz, which could keep commodity price volatility elevated, raise inflation risks and weigh on growth [1], particularly as global oil reserve buffers have declined from the start of the year. [5] This scenario may particularly add pressure to energy-importing economies’ external trade balances, affecting exchange rates and creating fiscal trade-offs where government measures are cushioning households and businesses from higher oil prices.
AI investment presents a two-way risk - while capital spending may remain a tailwind for growth in the coming months, it could also concentrate momentum in a relatively narrow set of sectors and financial assets. If monetisation, productivity gains, or end-demand were to fall short of market expectations, the AI cycle could add to overcapacity risk and financial volatility.
US: Resilient but more concentrated growth
The US is leading advanced markets growth at 2% for 1H 2026 and projected full-year GDP growth of 2.3%. However, the expansion is concentrated in technology investment , which contributed an estimated 37% to incremental growth in 1H 2026 (Figure 3), and in consumer spending by higher-income households (Figure 4). [7]
AI spending is expected to remain strong in 2H 2026, with full-year investment projected at USD 700–750 billion. [8] Financial market gains related to the AI and technology boom could also be providing additional support to spending among higher-income households, who tend to have greater exposure to financial assets. [9]
The key risk is renewed inflation. The global energy supply strains, pass-through from earlier tariffs, and rising electronics prices, partly linked to the AI buildout, are contributing upside pressures to already sticky inflation, making higher-for-longer policy rates more likely. [10]
This reinforces the K-shaped economic dynamic, where low- and middle-income consumers may face greater pressures on disposable incomes [11], while higher interest rates could weigh on interest-sensitive sectors such as housing and small business investment, raising concerns on fragility emerging from more concentrated growth.
Euro Area: Modest growth, cushioned by public spending and real wage growth
The Euro Area continues to face a slow recovery marked by energy vulnerability, weak industrial momentum, and competitiveness pressures. Real GDP growth is projected at 0.9% in 2026 and 1.2% in 2027, supported by public spending on defense, infrastructure, digitalisation, and green energy, while net exports remain a structural drag.[1]
The Iran conflict related energy pressures led to a sharp revision in consumers’ and business inflation and growth sentiment, according to ECB economic confidence surveys.[12] However, positive real wage growth, especially in services, is still supporting household consumption at a steady pace of around 1.5% year-on-year. [13]
Growth dispersion is widening. While manufacturing-led economies such as Germany, Austria, and Finland face stagnation from higher energy costs and intense export competition, services- and tourism-led economies such as Spain, Portugal, and Greece are better positioned to outperform.
China: New supply-side growth drivers
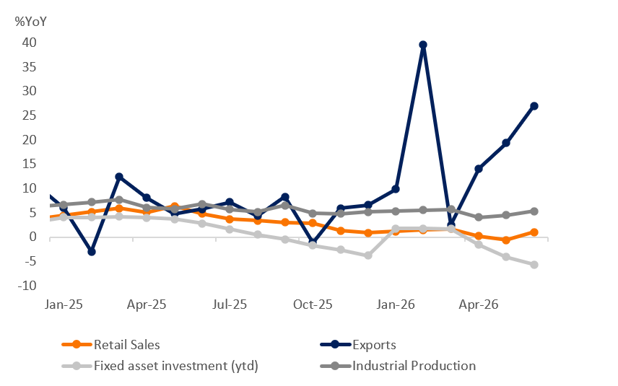
China is maintaining steady GDP growth of around 4.5%. The first half of 2026 benefited from strong export momentum (Figure 5), with exports up 17% year-on-year for 1H 2026 [14], supported by technology-related demand. According to the National Bureau of Statistics, “new growth drivers” including high-end manufacturing, AI-related industries, digital economy, modern services and green industries, contributed more than 40% of 1H 2026 GDP growth. [15]
Domestic demand remains uneven. Retail sales and fixed asset investment growth are softer compared to historical trends (Figure 5), while manufacturing investment outside of new-economy sectors has also been subdued. Household disposable income and consumer sentiment remains subdued, in part due to weaker income gains from property assets. Consumer inflation has remained muted amid soft domestic demand, despite a temporary lift from higher energy prices.
Figure 5: Key activity indicators for China show a surge in exports growth, while fixed asset investment remains a drag
Source: CEIC, National Bureau of Statistics
India: Robust domestic demand, but risks from energy dependence
India remains among the fastest-growing major economies, with GDP growth projected to moderate to 6.4% in FY 2026–27 from 7.7% in FY 2025–26[1]. Growth is anchored by domestic consumption, sustained public infrastructure investment, and continued expansion in high-value global services exports.
Both urban and rural household consumption remained robust in 1H2026, although latest RBI consumer confidence surveys [16] show rising concerns among consumers around the economy and price pressures. Domestic investment and capital expenditure remain resilient, as evidenced by indicators related to construction, capital goods and bank credit.[19] Services exports strength is sustained, growing by 7.5% in 1H2026 over 1H2025 [17], with support from rising demand for designing, deploying, and managing AI workflows and high-value functions including finance and R&D. [18]
Energy-import dependence remains the main macro vulnerability. Concerns around widening trade deficit have contributed to currency weakness. [19] Government measures are so far limiting the pass-through to consumer prices and CPI inflation is expected to remain contained at around 5.0% in FY 2026–27, according to the Reserve Bank of India. [19] However, prolonged high energy prices could erode domestic consumption strength and pressure fiscal capacity.
Developing Southeast Asia: Supply chain shifts and technology linkages are lifting growth unevenly
Developing Southeast Asia growth is projected at a steady 4.5–5%, according to Asian Development Bank [20], but country-level dispersion is widening. Vietnam leads regional growth averaging 8.2% in first two quarters of 2026, while growth in Thailand is projected to remain soft at 1.8% for the full year. [20]
The region is relatively well positioned to benefit from the technology hardware demand, reflected in stronger technology exports and foreign direct investment into data centers, semiconductor packaging, and electronics. Ongoing supply-chain diversion trends may also be supportive of investment in the region.
On the other hand, the region is vulnerable to energy disruptions from the middle east. Net energy importers such as the Philippines, Thailand, and Vietnam have experienced among the highest increases in inflation in Asia since the Iran conflict (Figure 2), while Malaysia, as a net energy exporter, experienced a modest inflation rise and currency appreciation.
Implications of the outlook for re/insurance
- Resilient growth is generally supportive of insurance demand, but the opportunity set is uneven. The AI capital expenditure cycle could create new insurance exposures linked to data centres, associated power infrastructure, equipment, and semiconductor manufacturing, while also contributing to a surge in trade volumes and value.
- Renewed cost inflation may affect non-life claims severity. Higher energy, freight, and input costs can feed into broader inflation and repair and replacement costs. Currency depreciation in some energy-importing economies can further raise the cost of imported materials and supplies.
- Diverging consumption patterns may affect the structure of insurance demand. Higher-income households and businesses serving them may support high-value personal and commercial exposures, while affordability pressure among lower- and middle-income segments could be associated with coverage changes, higher deductibles, or widening protection gaps.
- Geopolitics and trade fragmentation remain structural. Investments into supply-chain diversification, and public expenditure and support for industries considered important for geopolitical security are likely to remain important for future insurance demand and exposure patterns.
------------------------------------------------------------
References:
[1] IMF: WORLD ECONOMIC OUTLOOK UPDATE: Global Economy in Crosscurrents of War and Technology, July 2026
[2] Note: Observations based on quarterly GDP growth data, selected technology-related GDP components, and export values for semiconductors, memory chips and integrated circuits in these economies, based on publicly available data. Data source: CEIC
[3] Bloomberg: Why the AI Boom is Making Everything More Expensive, 8 March 2026
[4] IMF: Power Hungry: How AI Will Drive Energy Demand, Christian Bogmans, Patricia Gomez-Gonzalez, Ganchimeg Ganpurev, Giovanni Melina, Andrea Pescatori, Sneha Thube, April 2025
[5] S&P Global: The great oil reserves draw: how low can stocks go?, 11 June, 2026
[6] Selected technology investment categories include GDP categories listed under a) investment in computer and peripheral equipment and b) software intellectual property. Data source: US Bureau of Economic Analysis, CEIC
[7] Liberty Street Economics: The Federal Reserve Bank of New York, Tracking the K‑Shaped Economy: Who’s Driving Spending?, 1 May 2026, Rajashri Chakrabarti, Thu Pham, Beck Pierce, and Maxim L. Pinkovskiy
[8] Forbes: AI Spending Is Surging Faster Than Revenue And Markets Are Repricing, 2 June 2026
[9] JP Morgan Economics Research: The AI Wealth Effect, Michael Feroli and Abiel Reinhart, 16 October 2025
[10] Minutes of the Federal Open Market Committee, June 16-17, 2026
[11] McKinsey:US consumer sentiment weakens in 2026, May 28, 2026
[12] The ECB Blog: Geopolitical risk and scarring effects on consumer expectations: insights from the wars in Ukraine and Iran, 29 May 2026
[13] Calculated as the average year-on-year growth in Euro Area GDP household consumption category over past 4 quarters, using Eurostat data
[14] Xinhua: China's H1 foreign trade posts 16.9 pct growth with optimized structure, 14 July 2026
[15] Press conference by Deputy Director of the National Bureau of Statistics on the national economic performance for first half of 2026, 15 July 2026
[16] Reserve Bank of India Bi-monthly Publications
[17] Calculated using ‘International Trade Services Export Receipts Data’ from the Ministry of Commerce and Industry, India
[18] Reuters: India's offshore tech hubs hit $98.4 bln revenue in FY26, nearing 2030 forecast, report says, May 6, 2026
[19] Reserve Bank of India: Monetary Policy Statement, 2026-27 Resolution of the Monetary Policy Committee August 3 to 5, 2026
[20] Asian Development Bank: A FRAGILE OUTLOOK AS ENERGY MARKET DISRUPTIONS PERSIST, July 2026
------------------------------------------------------------
Disclaimer
Peak Re provides the information contained in this document for general information purposes only. No representation or guarantee is made as to the accuracy, completeness, reasonableness or suitability of this information or any other linked information presented, referenced or implied. All critical information should be independently verified and Peak Re accepts no responsibility or liability for any loss arising or which may arise from reliance on the information provided. All information and/or data contained in this document is provided as of the date of this document and is subject to change without notice. Neither Peak Re nor any of its affiliates accepts any responsibility or liability for any loss caused or occasioned to any person acting or refraining from acting on the basis of any statement, fact, text, graphic, figure or expression of belief contained in this document or communication.
The information is not intended to constitute, and should not be construed as, investment research, financial advice ( nor investment, tax, accounting or legal advice), or a recommendation of any kind.
All rights reserved. The information contained in this document is for your information only and no part of this document may be reproduced, stored or transmitted in any form or by any means, electronic, mechanical, photocopying, recording or otherwise, without the prior written permission of Peak Re. Any other information relating to this document, whether verbal, written or in any other form, given by Peak Re either before or after your receipt of this document shall be provided on the same basis as set out in this disclaimer. This document is not intended to constitute advice or recommendation, and should not be relied upon or treated as a substitute for advice or recommendation appropriate to any particular circumstances.
© 2026 Peak Reinsurance Company Limited.
Other Insights

Tue, 13 Oct 2026
| 10 mins
|
Kritika Kashyap
Mon, 21 Sept 2026
| 1 min
|
Victor Kuk

Fri, 18 Sept 2026
| 10 mins
|
Philip Hough

Thu, 10 Sept 2026
| 5 mins
|
Philip Hough

Wed, 9 Sept 2026
| 5 mins
|
Sudhir Salian
Elevate Your Business
with Peak Re
with Peak Re